
BestEx Research: Initiation of Coverage
Market Definition
GAII Intelligence defines the Quant, Portfolio & Analytics market as software and model services that apply machine learning to the quantitative core of investment management: generating return and risk forecasts, constructing and rebalancing portfolios, measuring and attributing performance, and estimating and minimising the cost of trading. Buyers are portfolio managers, quantitative researchers, heads of trading and the chief investment officers and technology teams who sign off on systematic processes.
Capabilities we treat as mandatory
- Point-in-time and backtest integrity: model inputs and simulations free of look-ahead and survivorship bias, with a documented method a quant team can reproduce.
- Out-of-sample and live evidence: performance or cost-reduction claims supported by live or held-out results, not only in-sample backtests.
- Institutional data handling: a stated position on where client holdings and order data go, how long they are held, and whether they are used for model training.
Capabilities we treat as differentiating
- Explainability of signals: forecasts, weights and cost estimates traceable to their drivers in a form a portfolio manager or risk committee can challenge.
- Independent, verifiable track record: live results published through regulated funds, third-party ratings or client-run A/B tests over several years.
- OMS/EMS and data-platform integration: native delivery into order and execution management systems, FIX, and the firm's data platform and Python stack.
- AI-assistant access: models and analytics reachable from the assistants portfolio managers and traders already use, through APIs or MCP, without loss of rigour.
BestEx competes with bank and broker algorithm suites, with independent execution and analytics providers such as Virtu Analytics, Abel Noser and Tradeweb, and, for its AMS One platform, with technology vendors that sell algorithm frameworks to the sell side.
Strengths
The following are the capabilities and characteristics that, in our assessment, most distinguish BestEx Research within the Quant, Portfolio & Analytics market. Each is drawn from publicly documented product capability, regulatory filings, published interviews with management, or independent review.
- Research depth: Execution models designed and documented in white papers, with out-of-sample validation on a full year of executions.
- Live A/B evidence: IS Zero tested against VWAP across more than 140,000 parent orders (company).
- Configurability: Strategy Studio exposes 150+ parameters without code; banks can build branded algorithms on AMS One.
- Asset-class reach: Global equities and futures on 21 exchanges, with 24×5 futures trading since April 2025.
- Shipping velocity: Four launches in 2026, from dark execution to AI-assistant access.
- Profitability: First profitable year in 2024 and volume up 87% (company).
Cautions
The following are factors that prospective clients should weigh, and areas where our public review did not find sufficient evidence to reach a settled view. Several are common across vendors at this stage of the market and are not specific to BestEx. We encourage prospective clients to raise each of them directly with the company; we have done the same, and will update this note as answers arrive.
- Assurance: SOC 2, ISO 27001 and SSO documentation not located.
- AI data handling: Pulse AI runs through third-party assistants such as Claude and ChatGPT; no data-handling or no-training terms published.
- Evidence: Cost-saving and A/B results are company-run; no independent evaluation located.
- Scope: Execution and cost analytics only; no optimiser, factor model or portfolio risk.
- Pricing: No prices or pricing model published.
- Capital: Funding last disclosed in 2023; $15m in total.
- Regulatory status: The firm's own registrations were not located.
Company Profile
BestEx Research Group LLC was founded in 2017 by Hitesh Mittal, formerly global head of trading at AQR Capital Management and, for more than a decade, head of algorithmic trading and POSIT at ITG. It is headquartered in Stamford, Connecticut, with offices in London and Bengaluru and development teams in India and Armenia. Its platform has been live since 2019.
BestEx raised a $5m Series A from QC Ventures, affiliated with the quantitative manager Quadrature, in December 2020 at a $50m valuation, and a $10m follow-on from existing investors in March 2023 at $110m. The company reported its first profitable year in 2024. Revenue is not disclosed.

| Legal entity | BestEx Research Group LLC |
| Founded | 2017 |
| Founder | Hitesh Mittal |
| Headquarters | Stamford, Connecticut |
| Headcount | ~55 (company, January 2025) |
| Disclosed funding | $15m: Series A (QC Ventures, 2020); follow-on (2023) |
| Ownership | Private; founder and venture investors |
| Revenue | Not disclosed; profitable in 2024 (company) |
| Volume | $893bn in 2024 (company) |
| Named clients | Scotiabank (Canadian platform) |
| AI layer | Pulse AI (August 2026) |
| Assurance | Not located |
Company-reported figures are shown as such and are not independently verified. Verification is carried into the vendor questionnaire.
Product and Capabilities
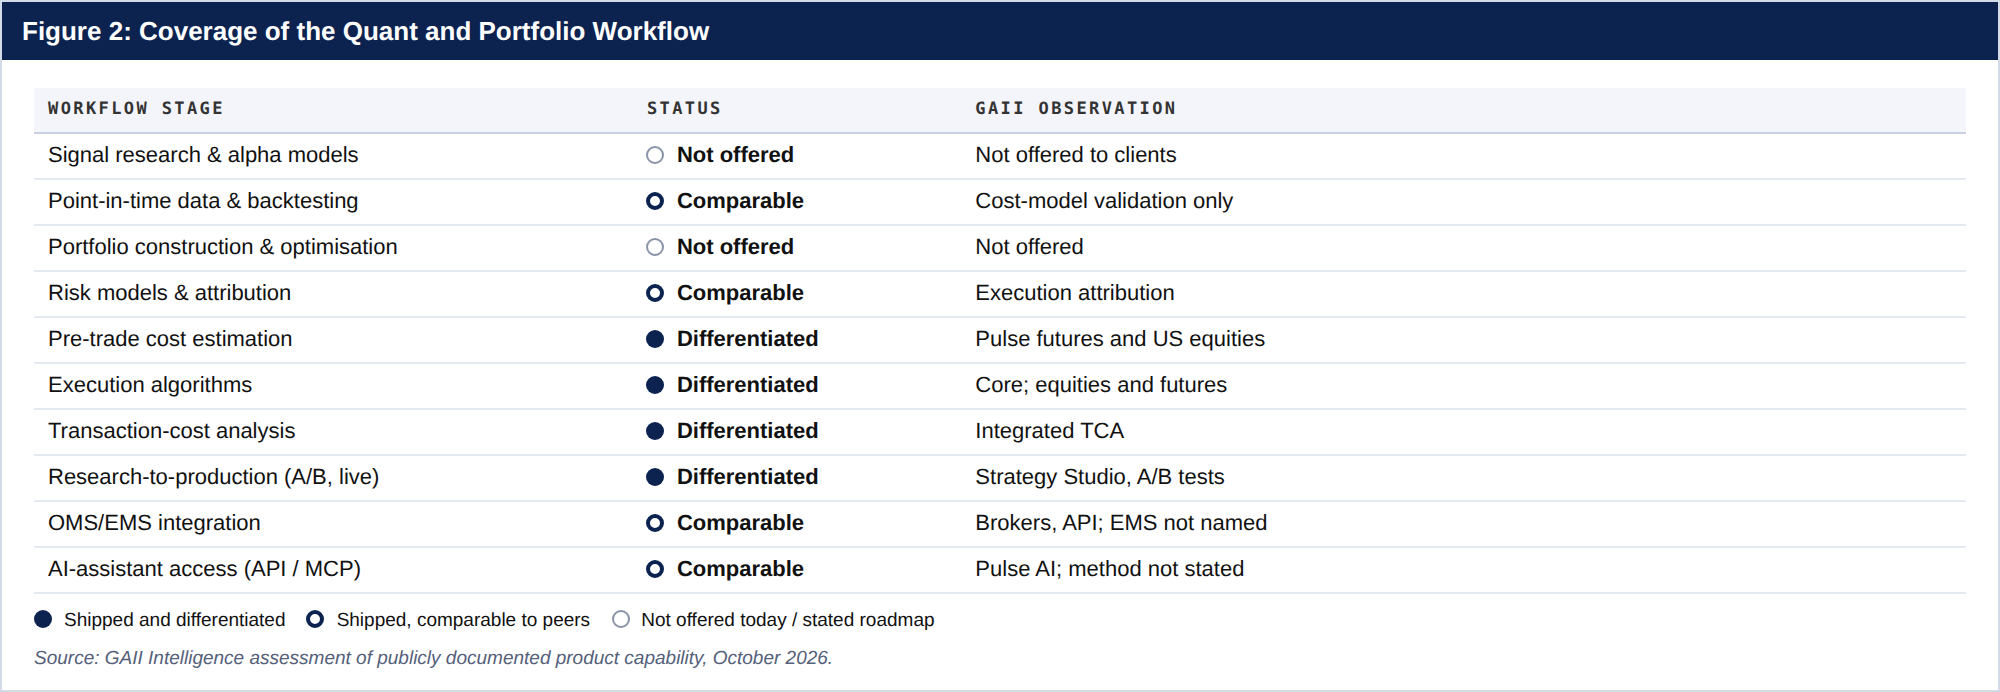
BestEx offers execution algorithms, a platform for running them, and cost analytics. Figure 2 sets out our assessment of how it maps onto the quant and portfolio workflow.
Execution algorithms
IS Zero, implementation shortfall, liquidity-seeking, Curator dark and close algorithms across equities and futures.
AMS and AMS One
Cloud algorithm management with Strategy Studio, smart order routing, monitoring, A/B testing and integrated TCA; AMS One lets banks and brokers run it as their own business (June 2026).
Pulse Analytics
Pre-trade market impact models for futures (2025) and US equities (September 2026), by dashboard and REST API.
Pulse AI
Conversational access to Pulse through clients' own AI assistants (August 2026).
Scope of the product today
We did not locate portfolio optimisation, factor risk models or return forecasting for clients; BestEx sits at the execution end of the workflow.
AI and Technology
The core models are quantitative rather than generative: the Pulse impact model combines more than one million institutional parent orders with cost sensitivities estimated from TAQ data, built on a "meta-order" view of daily supply and demand. The company states that the model is not built with AI; generative AI is the interface.
Validation is out of sample on a full year of executions, and execution algorithms are compared by live A/B tests. Both are company-run.
Data and Content
BestEx draws on tick and TAQ market data, minute bars, volume, volatility, spread and depth estimates, and its own institutional execution history across equities and futures.
It does not use or supply fundamental, alternative or factor data; broker-neutral post-trade TCA on clients' wider executions is scheduled for Q1 2027.
Investment Workflow Fit
BestEx fits trading desks and quant teams that want measurable execution quality: configurable algorithms, A/B testing and pre-trade cost estimates that can feed position sizing.
Portfolio construction, risk and attribution sit with other vendors, and named OMS/EMS integrations were not located.
Enterprise Readiness
BestEx runs a cloud-hosted, globally co-located platform and white-label deployments for sell-side firms. Figure 3 sets out what our public review located.
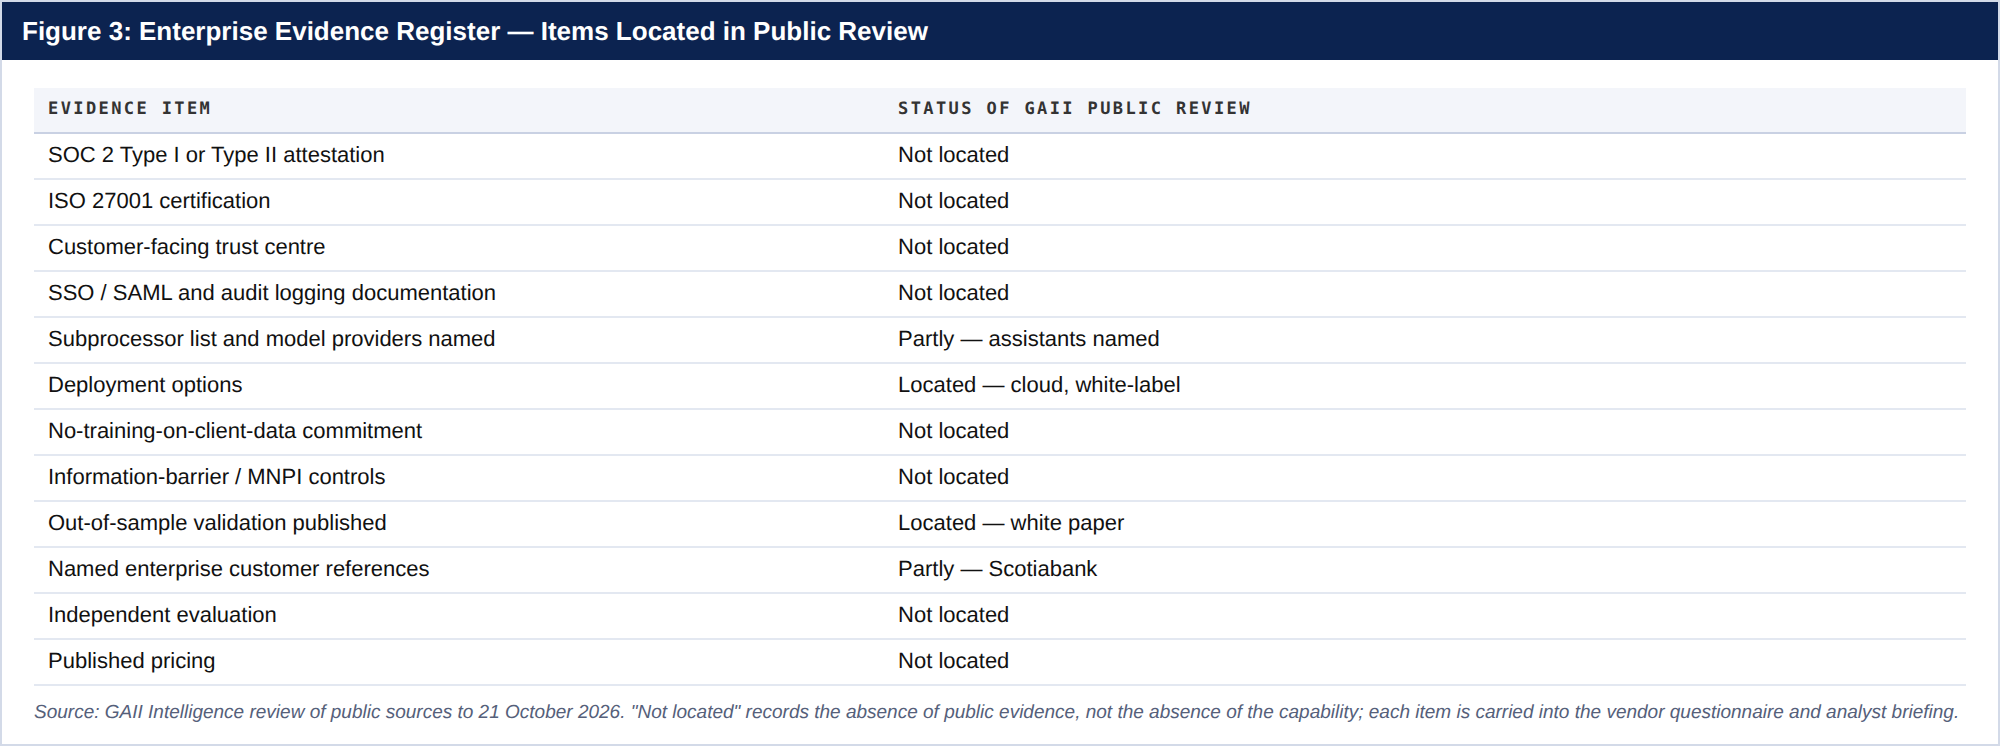
We would encourage buyers to request a SOC 2 report or equivalent, SSO and access-control documentation, data-handling and no-training terms for Pulse AI, and the firm's regulatory registrations.
The offsetting factor is operating evidence: a live platform since 2019, a bank partner in Scotiabank and a reported first profitable year.
Commercial Model
Pricing is not published, nor is the commercial model for algorithms, AMS One or Pulse.
Buyers should request pricing alongside a structured A/B test against current algorithms.
Competitive Position
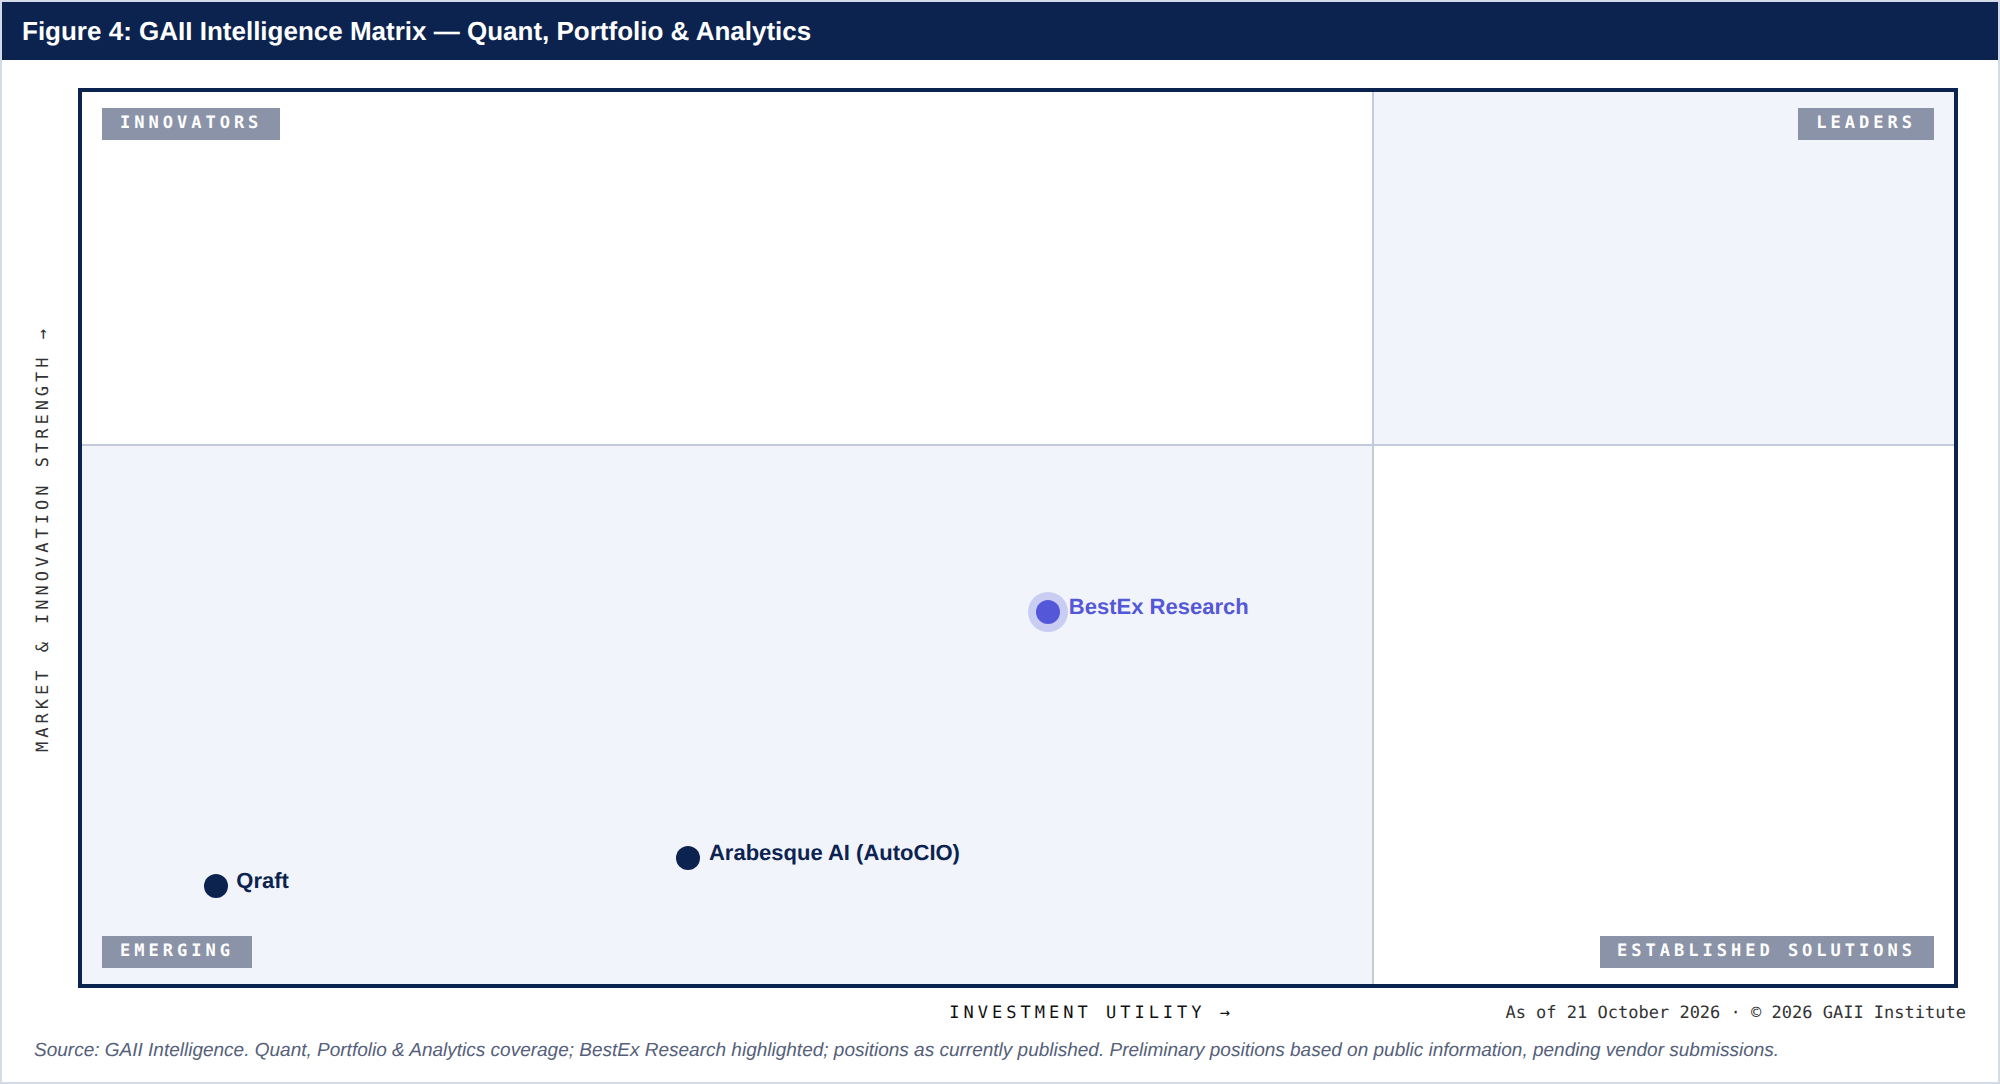
BestEx sits in the Emerging quadrant of the segment matrix, with the highest overall score of the three companies in the segment so far; as an execution specialist it is scored partly on portfolio-construction criteria it does not target.
| COMPANY | SCORE | RATING | OUTLOOK | MATRIX QUADRANT |
| BestEx Research | 6.51 | Established | Improving | Emerging |
| Arabesque AI (AutoCIO) | 5.85 | Emerging | Stable | Emerging |
| Qraft | 5.17 | Watch | Stable | Emerging |
GAII Quant, Portfolio & Analytics coverage, 21 October 2026, scored on the segment variant of Data & Content and Workflow Fit; not directly comparable with Research & Intelligence or Risk, Compliance & Surveillance scores.
11.1 Where BestEx is strongest relative to peers
- Against bank algorithm suites, on independence and measurable cost evidence.
- Against TCA vendors, on predictive pre-trade models rather than historical reports.
- Against algorithm-framework vendors, on research-tested algorithms delivered with the platform.
11.2 Areas of narrower functional focus
BestEx has built depth in execution rather than enterprise documentation or portfolio tools.
- Assurance: no certifications located.
- Pricing: not published.
- Scope: no portfolio construction.
- Capital: small disclosed funding.
Score Summary
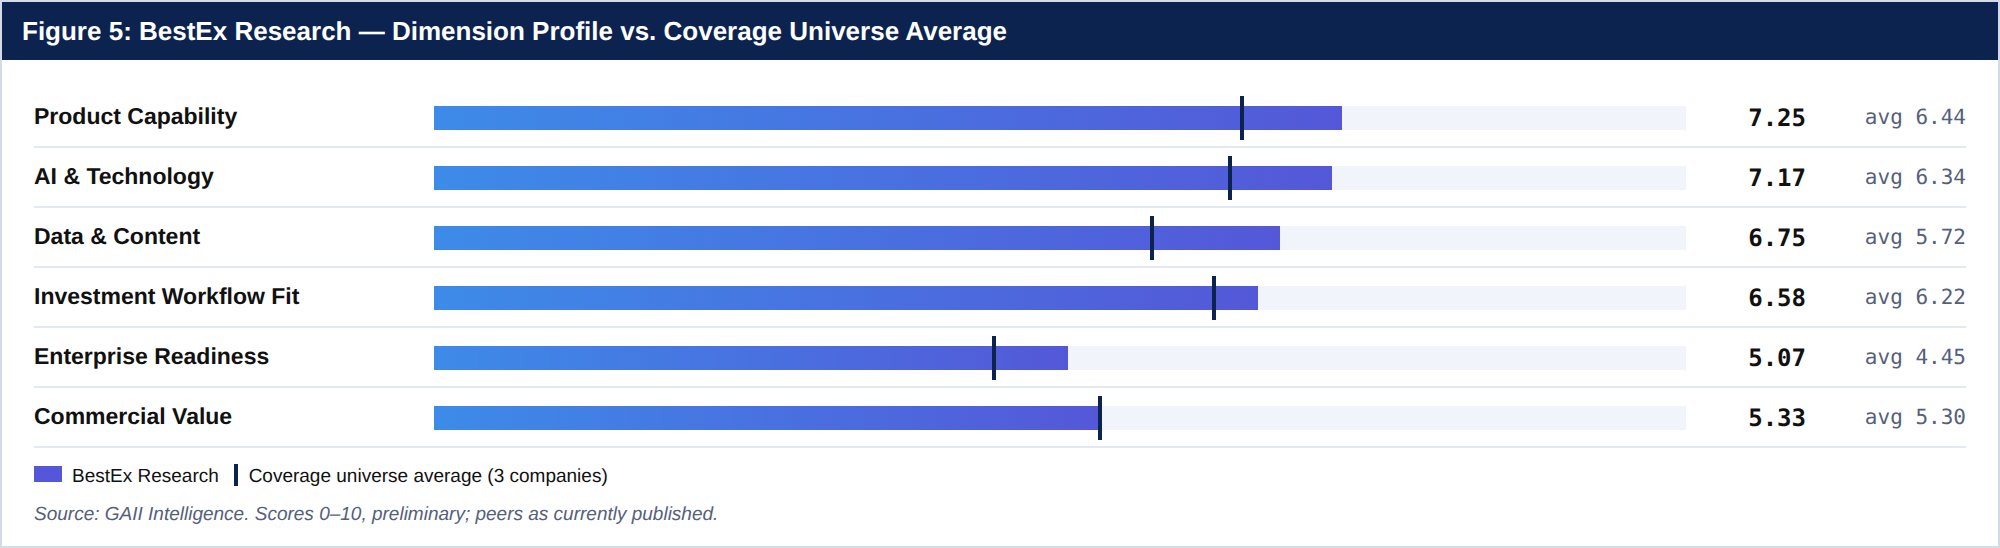
Scores are on a 0–10 scale. Each dimension score is the mean of its sub-criteria, and the GAII Overall Score is the weighted mean of the six dimensions. The detailed sub-criteria scores that build each dimension are set out in Appendix A.
| DIMENSION | WEIGHT | SCORE | ASSESSMENT |
| 1. Product Capability | 20% | 7.25 | Strong execution product; configurable. |
| 2. AI & Technology | 20% | 7.17 | Sound quantitative models; company-run validation. |
| 3. Data & Content | 17.5% | 6.75 | Deep execution data; no factor coverage. |
| 4. Investment Workflow Fit | 17.5% | 6.58 | Strong research-to-production; no optimiser. |
| 5. Enterprise Readiness | 15% | 5.07 | Cloud and white-label; documentation gaps. |
| 6. Commercial Value | 10% | 5.33 | No prices. |
| GAII OVERALL SCORE | 100% | 6.51 | Established; Emerging quadrant. |
Open Questions
These are the areas where our public review did not find sufficient evidence to form a settled view. We have put them to the company and will update this note when they are answered. Prospective clients may find them a useful agenda for their own evaluation call.
- SOC 2 or ISO 27001 status.
- SSO, SAML and access controls.
- Data handling and no-training terms for Pulse AI.
- Which assistants and integration method Pulse AI uses (API, MCP).
- Regulatory registrations of the firm.
- Named OMS/EMS integrations.
- Pricing model for algorithms, AMS One and Pulse.
- Client count and named references.
- Independent evaluation of IS Zero and Pulse.
- Revenue and runway.
- Funding plans.
- Global equities cost model timing.
Context — How To Use This Research
This note is an assessment of a vendor against a defined framework, not a recommendation to buy or to decline. The following are the considerations we would put at the centre of an evaluation of BestEx specifically.
If you run portfolios, quant research or trading
- Run an A/B test of IS Zero against your current VWAP algorithm.
- Use Pulse cost estimates in position sizing.
- Keep portfolio construction with existing tools.
If you are responsible for technology or vendor risk
- Open with Figure 3; request SOC 2 and SSO.
- Review Pulse AI data flows through your assistant.
- Map FIX and OMS/EMS connectivity.
If you are assessing the category rather than the company
- Execution analytics are becoming predictive.
- AI assistants are reaching trading analytics.
- Independent algorithm providers now sell platforms to banks.
Appendix A — Sub-criteria Detail
Each dimension score in Section 12 is the mean of the sub-criteria below. Data & Content and Investment Workflow Fit use the Quant, Portfolio & Analytics segment variant.
| DIMENSION | SUB-CRITERION | SCORE |
| Product Capability | Workflow breadth | 7.0 |
| Output quality | 7.0 | |
| Agentic autonomy and task horizon | 6.5 | |
| Usability and time-to-value | 7.0 | |
| Deliverable fidelity (portfolios, signals, analytics) | 7.5 | |
| Configurability to mandate and constraints | 8.5 | |
| AI & Technology | Model strategy and provider dependency | 7.0 |
| Retrieval and reasoning architecture | 6.5 | |
| Explainability of signals and model outputs | 7.5 | |
| Published evaluation evidence (live and out-of-sample) | 6.5 | |
| Engineering depth | 7.5 | |
| Shipping velocity | 8.0 | |
| Data & Content | Model inputs breadth (market, fundamental, alternative) | 5.5 |
| Factor, risk and benchmark coverage | 4.5 | |
| Client portfolio and holdings ingestion | 6.5 | |
| Point-in-time and backtest data integrity | 7.0 | |
| Transaction-cost and execution data | 9.0 | |
| Methodology transparency and auditability | 8.0 | |
| Investment Workflow Fit | Portfolio-manager and quant-native design | 7.0 |
| Portfolio construction and optimisation | 4.5 | |
| Risk monitoring and attribution | 6.0 | |
| Research-to-production workflow (backtest, paper trade, live) | 8.0 | |
| OMS/EMS and data-platform integration | 6.5 | |
| Adoption support | 7.5 | |
| Enterprise Readiness | Security certification evidence | 3.0 |
| Deployment options | 6.5 | |
| Data governance and no-training commitments | 3.5 | |
| Access control and audit logging | 4.0 | |
| Regulatory compliance and MNPI controls | 5.0 | |
| Vendor viability and scale | 6.5 | |
| Support and service model | 7.0 | |
| Commercial Value | Price transparency | 2.5 |
| Total cost of ownership | 5.5 | |
| Value against the alternative | 7.5 | |
| Contract flexibility and trial | 5.0 | |
| Documented return-on-investment evidence | 6.0 | |
| Pricing-model alignment (incl. AUM- or performance-linked fees) | 5.5 |
Methodology
The GAII Intelligence Framework scores every company in coverage on six dimensions, each built from sub-criteria. Evidence is weighted in descending order: verifiable primary evidence such as attestations, contracts, published documentation and named references; then the company's completed GAII questionnaire and analyst briefing; then public secondary sources. Claims that cannot be corroborated are recorded as company-reported and do not raise a score.
| 1. Product Capability | 20% | What the product does: workflow breadth, output quality, agentic autonomy, usability, fidelity of deliverables, configurability. |
| 2. AI & Technology | 20% | How it is built: model strategy and provider dependency, retrieval and reasoning, citation fidelity, published evaluation, engineering depth, shipping velocity. |
| 3. Data & Content | 17.5% | What it knows: filings and transcripts, expert content, broker research, consensus data, client-material ingestion, coverage and auditability. |
| 4. Investment Workflow Fit | 17.5% | How it fits the process: buy-side design, idea generation, monitoring, modelling, delivery surfaces, adoption support. |
| 5. Enterprise Readiness | 15% | Whether it can be bought: certifications, deployment, data governance, access control, compliance, vendor viability, support. |
| 6. Commercial Value | 10% | Whether it is worth it: price transparency, total cost of ownership, value against the alternative, contract flexibility, return evidence, pricing alignment. |
Rating bands
| 8.5 – 10.0 | Leader | Category-defining capability with the platform maturity to support standardisation across a firm. |
| 7.5 – 8.4 | Strong | Suitable for enterprise deployment following normal diligence. |
| 6.5 – 7.4 | Established | Credible for targeted deployment, with specific areas to clarify during evaluation. |
| 5.5 – 6.4 | Emerging | Well suited to pilot deployment while particular capabilities continue to develop. |
| Below 5.5 | Specialist | Deliberately narrow functional focus, or areas we are still evaluating. |
Outlook definitions: Improving — we expect the overall score to rise at the next review on evidence already visible. Stable — no directional change expected within two review cycles. Softening — we expect the score to decline on competitive, commercial or execution evidence. Under Evaluation — material questions remain open; the score may move in either direction once they are resolved.
Matrix construction: Investment Utility (horizontal) = Product Capability × 0.40 + Data & Content × 0.30 + Investment Workflow Fit × 0.30. Market & Innovation Strength (vertical) = AI & Technology × 0.40 + Enterprise Readiness × 0.35 + Momentum × 0.25, where Momentum is a separate 0–10 assessment of capital position, traction, growth and strategic backing. Quadrant boundaries sit at 7.50 on both axes for the current cohort and are restated at each quarterly review.
Relationship Disclosure
GAII Institute organises the annual Generative AI in Investment Management (GAIIM) conference, at which companies covered in this universe may appear as speakers, exhibitors or sponsors. No relationship between GAII Institute and BestEx Research Group LLC was identified at the date of this note. Scored on the GAII segment variant for Quant, Portfolio & Analytics: Data & Content and Investment Workflow Fit use quant-specific sub-criteria (model inputs, factor and benchmark coverage, holdings ingestion, point-in-time integrity, transaction-cost data; portfolio construction, risk and attribution, research-to-production, OMS/EMS integration). Published evaluation credits live and out-of-sample track records, and Commercial Value accepts AUM- or performance-linked fees. Weights and the other four dimensions are unchanged. Scores are comparable within the segment, not directly with Research & Intelligence or Risk, Compliance & Surveillance scores.
Important Disclosures
Copyright and distribution. © 2026 GAII Institute. All rights reserved. GAII Intelligence and GAII Intelligence Matrix are marks of GAII Institute. This publication is licensed to the named recipient and may not be reproduced, redistributed, republished, posted, transmitted or made available to any other person, in whole or in part, in any form or by any means, without the prior written permission of GAII Institute.
Nature of this publication. This publication consists of the opinions of the GAII Intelligence research team as at the date shown and is subject to change without notice. It should not be construed as a statement of fact. While the information contained in it has been obtained from sources believed to be reliable, GAII Institute disclaims all warranties, express or implied, as to the accuracy, completeness or adequacy of that information. Ratings and scores are analytical opinions and are not a guarantee of any vendor's performance, viability or suitability.
Not investment, legal or procurement advice. Although GAII Intelligence research may address commercial, legal and financial matters, GAII Institute does not provide investment, legal or accounting advice, and this publication should not be construed or used as such. It is not a recommendation to buy, sell or hold any security or private interest, and it is not a substitute for the reader's own evaluation, diligence and procurement process.
Independence and objectivity. GAII Intelligence ratings are not for sale. No fee, sponsorship, membership, conference participation or other commercial relationship influences a rating, a score or a position on the GAII Intelligence Matrix, and analysts are not compensated on the basis of vendor relationships. Covered companies receive a factual-accuracy review before publication; they may correct factual errors and may not alter analysis, scores or wording.
Use in artificial intelligence systems. This publication may not be used as input into, or for the training, fine-tuning or development of, any generative artificial intelligence model, machine learning system, algorithm, software or related technology.
Log in as a member to download the full report.